Object Detection with YOLO, Explained
 Abhay
4 min read
Abhay
4 min read
Ask a classifier “what’s in this photo?” and it answers, confidently, “a cat.” Helpful. But if the photo has a cat, a dog, and a suspiciously empty food bowl, the classifier just picks one label and shrugs. It tells you what is in the image, never where, and never how many. For a self-driving car, “there is a pedestrian somewhere on screen” is not a reassuring sentence.
That gap is exactly what object detection fills. And the model that made detection fast enough to be useful is YOLO.
Classification vs. detection
Classification maps a whole image to one label. One image in, one answer out.
Detection does two harder jobs at once: it draws bounding boxes (where each thing is) and attaches a label with a confidence score to each box. So instead of “cat,” you get “cat at (x, y, w, h), 0.94 confidence; dog at another box, 0.88; bowl, 0.71.” It’s the difference between a witness saying “there was a crime” and one who gives you coordinates, a description, and a timestamp.
The catch: detection is computationally brutal. Early approaches like R-CNN proposed thousands of candidate regions and ran a classifier on each one. Accurate, but slow as treacle — useless for video.
How YOLO does it in one pass
YOLO stands for You Only Look Once, and that name is the whole pitch. Instead of scanning an image thousands of times, YOLO runs a single neural network over the entire image once and predicts all boxes and labels in one forward pass. That’s why it hits real-time speeds.
The classic recipe works like this:
- Grid. The image is divided into a grid (say 13×13). Each cell is responsible for detecting objects whose center falls inside it.
- Anchors (or not). Early YOLO versions used anchor boxes — predefined box shapes that act as templates the model nudges into place, which helps with objects of wildly different aspect ratios. Modern versions (YOLOv8 onward) went anchor-free, predicting box geometry directly. Fewer hand-tuned knobs, cleaner training.
- IoU. Intersection over Union measures how much a predicted box overlaps the true box: the area of their overlap divided by the area of their union. 1.0 is a perfect match, 0 is a total miss. It’s the yardstick for “is this box actually correct?”
- NMS. A confident model will fire several overlapping boxes at the same object. Non-Maximum Suppression is the cleanup crew: keep the highest-confidence box, then delete any box overlapping it too much (by IoU). One object, one box. (The newest YOLO releases are even going NMS-free, folding this step into the network itself.)
The metric: mAP
How do you score a detector? Accuracy doesn’t cut it — there’s no single right answer per image. The standard is mean Average Precision (mAP).
In short: for each class you compute a precision-recall curve and take the area under it (Average Precision), then average across all classes. You’ll often see [email protected] (a box counts as correct if its IoU with the ground truth is at least 0.5) or the stricter [email protected]:0.95, which averages over multiple IoU thresholds and punishes sloppy boxes. Higher is better; nobody agrees on what “good” is until you check the threshold.
Running it yourself
The modern API (Ultralytics) is almost insultingly simple. Verified against current Ultralytics docs:
from ultralytics import YOLO

# Load a small COCO-pretrained model (downloads on first run)
model = YOLO("yolo11n.pt")

# Run detection on an image
results = model("street.jpg")

# Inspect the boxes, labels, and confidence scores
for r in results:
    for box in r.boxes:
        cls = model.names[int(box.cls)]
        conf = float(box.conf)
        xyxy = box.xyxy[0].tolist()  # [x1, y1, x2, y2]
        print(f"{cls}: {conf:.2f} at {xyxy}")

# Save an annotated copy with boxes drawn on
results[0].save(filename="street_detected.jpg")
Three lines to load and predict; the rest is just reading the output. That accessibility is a big reason YOLO is everywhere.
Where it actually shows up
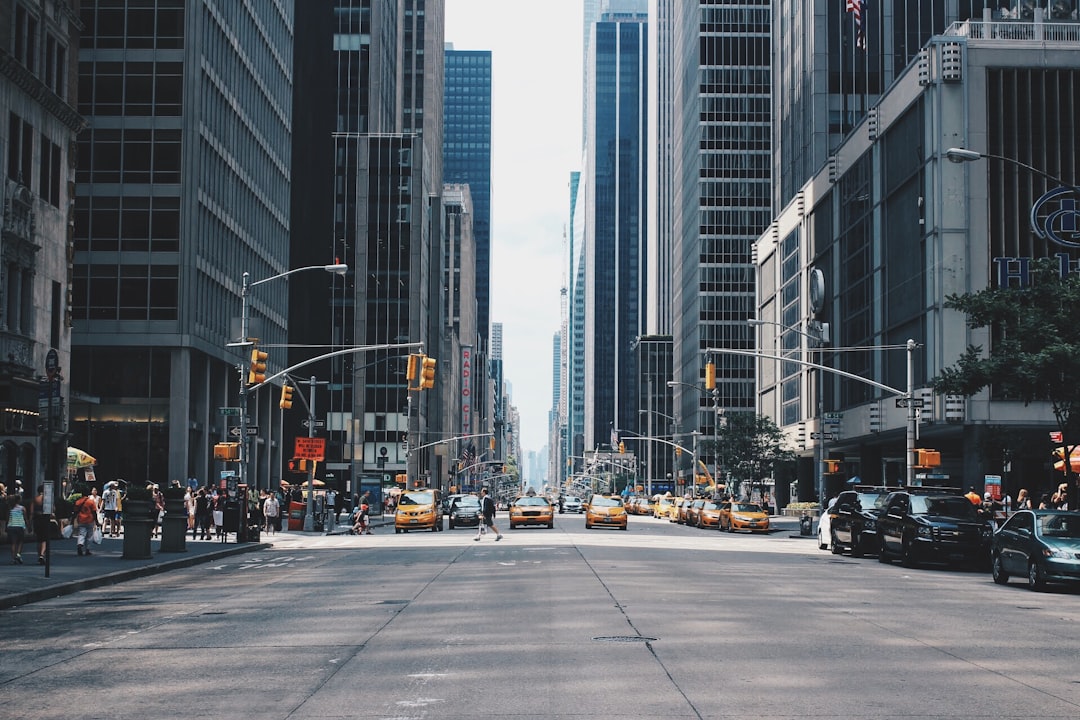
YOLO is the quiet workhorse behind a lot of “computers that see”: traffic and city cameras counting vehicles and spotting jaywalkers, retail tracking shelf stock, agriculture counting fruit and flagging weeds, medical imaging flagging regions of interest, manufacturing catching defects, and the autonomy stacks where milliseconds matter.
A note on the family tree
YOLO has had a soap-opera lineage. Joseph Redmon created v1–v3, then quit computer vision in 2020 over ethical concerns about military and surveillance uses. Ultralytics picked up the torch with the wildly popular YOLOv5; the line marched on through anchor-free YOLOv8, NMS-free experiments in YOLOv10, YOLO11, an attention-based YOLOv12, and the edge-focused, end-to-end YOLO26 in early 2026. Different authors, shared name, one obsession: looking once, fast.
The takeaway
When you reach for a vision model, ask one question first: do you need to know what, or what and where? If it’s the latter — boxes, counts, positions — that’s detection, and YOLO is the sensible default. Grab a pretrained yolo11n.pt, run the five lines above on your own images, and read the boxes output before you train anything. You’ll learn more from one prediction loop than from a week of theory.